
The Energy Futures Lab is all about transitioning Alberta’s energy system for a sustainable future. But what do we mean by the “energy system” exactly? Are we talking about oil and gas or renewables or both? What about the electricity generation and transmission infrastructure? All of those are part of the system. But those are talking about physical things, raw materials and their transportation. What about how we actually use energy?
There is too much information to make sense of it all at once but by breaking into layers, you can see the detail and see how it all fits together. And that’s what we did for the EFL.
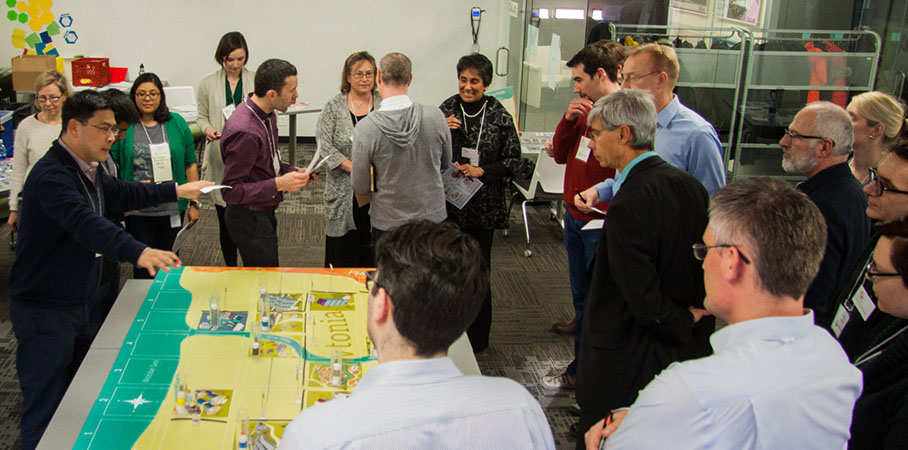
After all, no one really wants just energy – they want the services that energy produces like heating, cooling, transportation, food, lighting and the use of whatever device you are reading this blog post with! There are so many different ways to look at the energy system, it can seem like an impossible task. Nonetheless, that was the task I was given: develop a visual representation of the energy system in Alberta and present that to 40 people (the EFL Fellows) that have spent their whole careers working in the energy system – gulp!
The approach I took was based on layers. Remember those old books about the human body? The ones with a picture of the body with different layers of transparencies – one layer with bones, the next with veins, the next with the nervous system, etc. There is too much information to make sense of it all at once but by breaking into layers, you can see the detail and see how it all fits together. And that’s what we did for the EFL.
The base layer takes a value chain approach, starting with raw materials on the left and working toward energy end-use (including export) on the right. We also split the system into two rows – the top for hydrocarbons, the bottom for thermal (heat) and electrical. While there are many interconnections between these two (for example, coal is burned to generate electricity), the industries and regulatory bodies in Alberta are often separate.
While this is a good coverage of the raw materials, it doesn’t leave much room for the human and natural elements. The next layer brings in natural systems and communities showing the relationship of extracting materials from the earth’s crust and putting material back into the biosphere. And of course, communities are in the middle gaining benefits from the energy system (jobs, services, etc.) but also taking on risks and impacts (economic dependence, environmental impact).
Economic drivers is another hugely important layer. As we have been made keenly aware recently, Alberta’s energy system does not work in a vacuum. Factors like demand for energy from China, actions taken by Saudi Arabia that impact the price of oil, the strength (or lack thereof) of the Canadian dollar, labour costs and investors from outside Alberta all have massive impacts on the energy system so their impacts need to be shown.
At each stage of energy value chain Albertans are innovating. The technological innovation layer maps development such as fracking, cheap solar PV, co-generation of power, smart grids, geothermal and carbon capture and storage. All of these innovations have the potential to shift and disrupt the way we generate, transport, store and use energy. But do they have the ability to shift the whole system?
The final layer looks at some of the broader trends that are impacting the energy system and need to be taken into account when looking at system shifts. Here we are talking about big landscape shifts like the United States (our biggest customer) becoming energy-independent by 2020 or the impact of new Provincial and Federal governments. It is also important to map the narratives around energy and their impacts. For example, the narratives of “Canada is an energy superpower” and “Canada is a climate dinosaur” illustrate very different views of how energy fits into our world and our role in developing these resources.
And how did the presentation go? Well, there was a LOT of feedback! While everyone in the room had seen different versions of such a map, there were a lot of opinions. Some Fellows wanted to see more explicit inter-connections between components – for example, the link between hydrocarbon extraction and electricity production. Others wanted to further highlight the energy system services rather than the raw materials. And others thought that maybe the whole system should be drawn as a circle rather than a line to emphasize the full life-cycle of energy use. In the end, all of the Fellows agreed this was a useful starting point. The Fellows thought this model will be useful in building awareness on the complexities of the energy system, as a decision making tool and a way to map the work of the EFL to the different layers. There was also interest in making the model interactive so we can ask questions like how much electricity is Alberta using now? What if we changed our electric mix? What if our homes become more efficient users of energy?
Following the workshop in Edmonton, work has continued with a small group of Fellows including Matt Beck, Binnu Jeyakumar, Michael Benson and Nathan Maycher. We have been meeting to talk about updates to the model, potential uses and new layers to add. After these updates, we will share the results with the whole EFL team in Fort McMurray in May closing the loop and letting the Fellows take the work forward.
So that’s our multi-layer view of the energy system. And this is just the start! We will be continuing to evolve these layers and will keep you posted on that. There has been lots of work done in the past (such as (Jaccard, 2005; Lovins, 1976; Robinson, 1987a; 1987b; Stern, 2014) on visualizing energy systems in general. We have also collected a number of Alberta and Canada-specific visualizations in the Energy System Database. Take a look and be sure to let us know if you see a great way of representing the energy system!
References
- Jaccard, M. (2005). Sustainable Fossil Fuels. Cambridge: Cambridge University Press.
- Lovins, A. (1976). ENERGY STRATEGY: THE ROAD NOT TAKEN? Foreign Affairs, 55(1), 65–96.
- Robinson, J. (1987a). Insurmountable opportunities? Canada’s energy efficiency resources. Energy, 12(5), 403–417. http://doi.org/10.1016/0360-5442(87)90109-5
- Robinson, J. B. (1987b). An embarrassment of riches: Canada’s energy supply resources. Energy, 12(5), 379–402. http://doi.org/10.1016/0360-5442(87)90108-3
- Stern, P. C. (2014). Individual and household interactions with energy systems: Toward integrated understanding. Energy Research & Social Science, 1, 41–48. http://doi.org/10.1016/j.erss.2014.03.003

Steve Williams is a technology strategist designing and facilitating participant-driven public engagement events with over 20 years experience in the software industry
