The Energy Futures Lab is all about the energy system. In fact, the idea is built right into our convening question “How can Alberta’s leadership position in today’s energy system serve as a platform for transitioning to the energy system the future needs?”
But what do we really mean by the energy system?
It is important to keep in mind the great quote from George E.P. Box
“All models are wrong but some are useful”.
Is the energy system all about oil and gas? What about electricity production? Does it include renewables? Transportation? Agriculture? Are we talking about Alberta alone? Or in a Canadian context? What about exports to the US and overseas? And what about how people actually use energy? These are all parts of the energy system which makes creating a single picture quite a challenge.
To try and address this challenge, we thought about those old anatomy books that used transparency layers to show different parts of the body. What would it look like to have multiple layers of the energy system?

http://www.glocktalk.com/
attachments/image-jpg.240989/
I took this idea and started my research looking at energy maps and models from the International Energy Association, Student Energy, CESAR, and others to create a first draft map. After garnering a LOT of feedback from the Fellows who live, work and breathe the energy system, a sub-group of fellows – Nathan Maycher, Binnu Jeyakumar, Matt Beck & Michael Benson – met with me over a couple of months to refine the model and present the revised version for the Fellowship’s approval. It is important to keep in mind the great quote from George E.P. Box – “All models are wrong but some are useful”. What he was getting at is that all models are simplifications with trade-offs between completeness and understandability. The draft map and layers we have agreed on are simplified versions of reality but have enough fidelity that we can start to see patterns and map our activities (such as prototypes and Innovation Pathways) to the model.
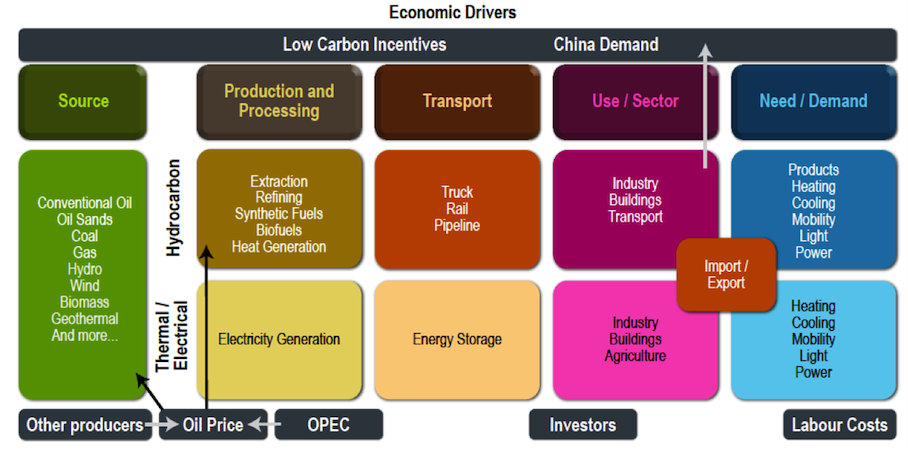
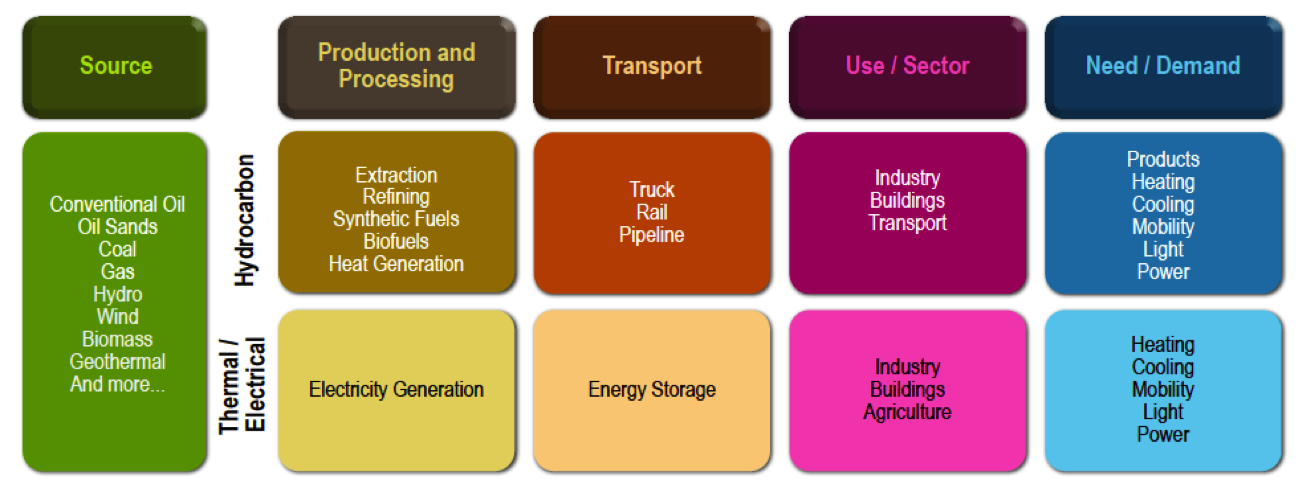
So what did we end up with? First, we have a Base Layer. This takes a value chain approach with raw materials at the left and energy use at the right. There are two rows – the first representing the hydrocarbon part of the system, the second thermal (heat) and electricity generation. One of the first things to notice is that the real system is not this organized! Hydrocarbons are used for electricity production, biofuels can be used for transportation, heat can come from natural gas, electricity or geothermal. But mapping the system this way lets us start to zero in on where we want to make impact and be more precise about our descriptions.
Working draft
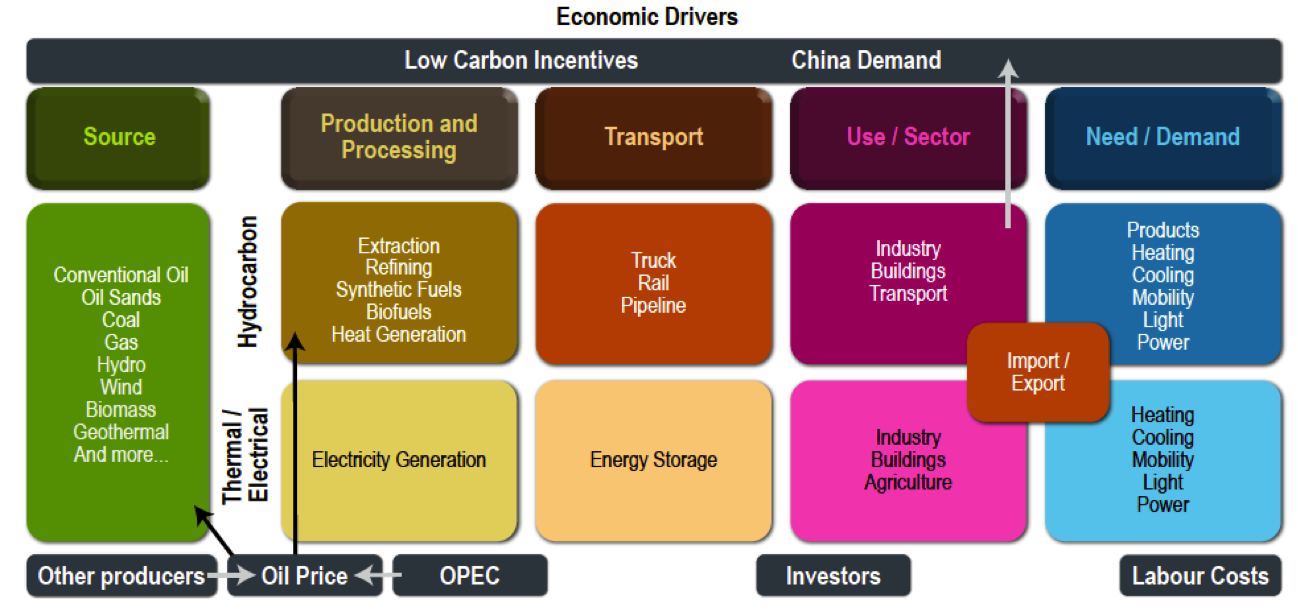
Next, we looked at the economic drivers of the energy system. First and foremost is the import and export of energy – one of the driving forces of Alberta’s and Canada’s economy. Those imports and exports, and the development of Alberta’s energy system in general are impacted by factors outside the province like the level of demand for energy from China, actions by OPEC and other producers that affect the price of oil, labour costs and incentives for low carbon production.
Working draft
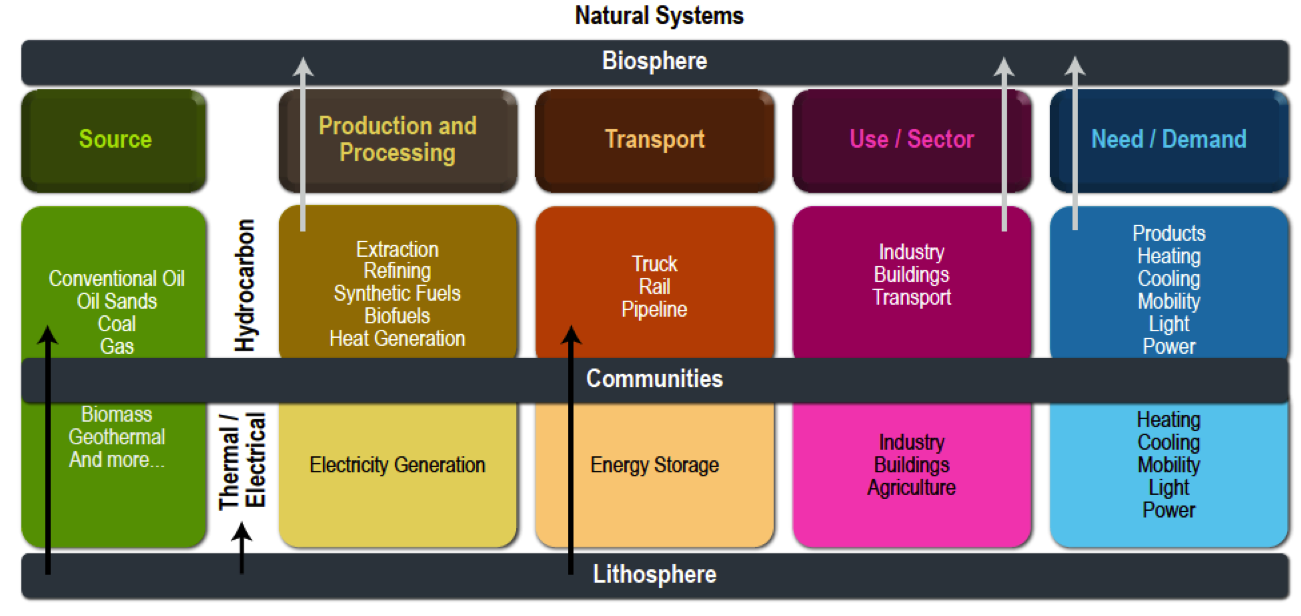
In addition to economics, there are obvious environmental connections for the Alberta energy system. Here we used the Natural Step’s four system conditions of a sustainable society which includes looking at what we are extracting from the lithosphere (the Earth’s crust) and what we are putting back into the biosphere. Communities are right in the middle as they both benefit from and are exposed to the risks of energy production in the province.
Working draft
Next up is looking at the energy system through the Multi-Level Perspective on systems transition. All of the work we do is within a broad socio-cultural landscape that includes narratives like “Canada is an energy superpower” and political events like changing governments. Within the regime are the “rules of the game” in the form of regulations, legislation, policy and organizations such as the Alberta Energy Regulator, building codes, renewables policy and our existing energy infrastructure.
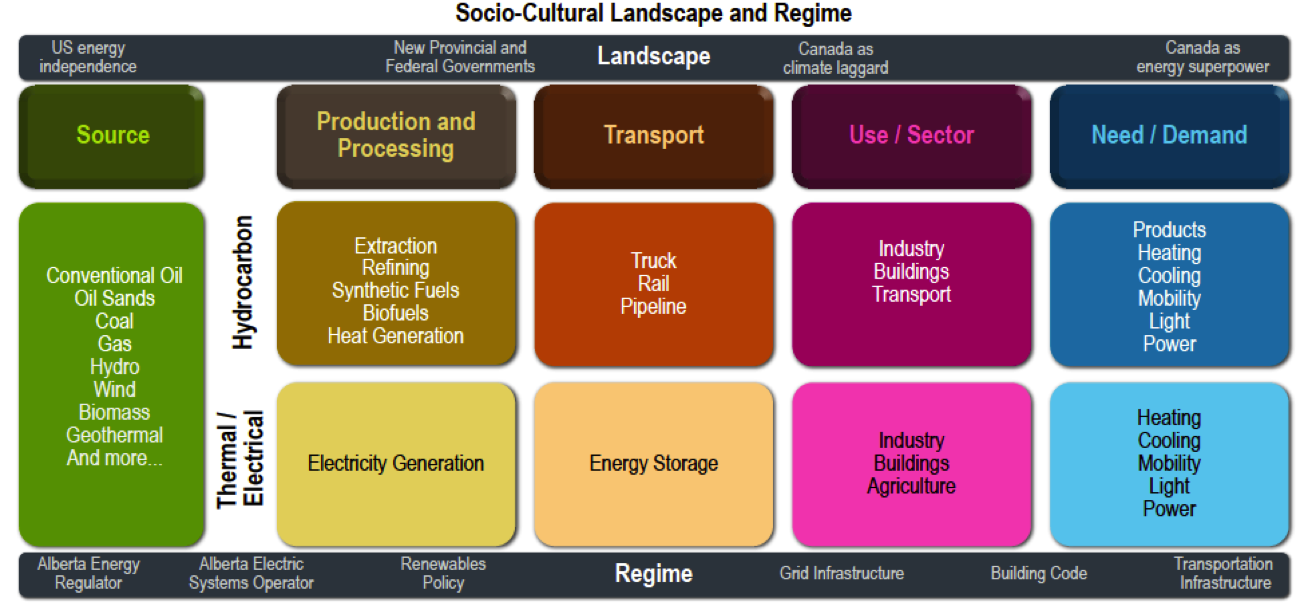
Working draft
At the niche level, Albertans are innovating in many ways – in cleaner oilsands production, in renewable technology, in energy storage and in policy.
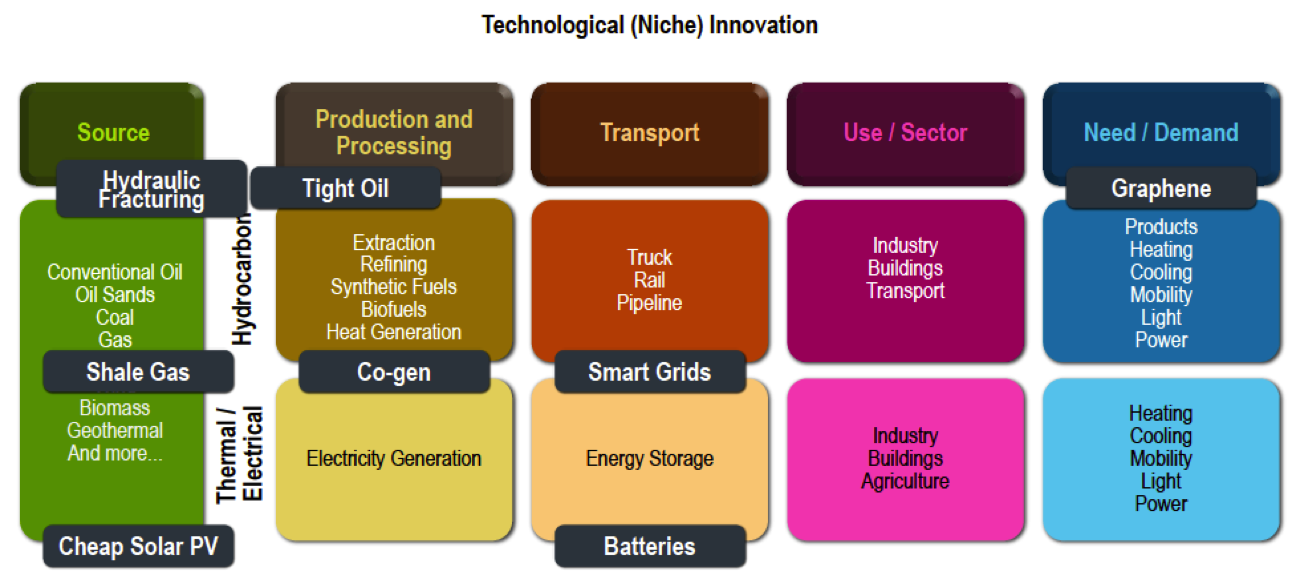
Working draft
Finally, we have stakeholders. This includes industry, landowners, towns and cities, Indigenous communities and the public at large. All of these groups are impacted by the energy system in one way or another and all have opinions and views that must be taken into account as we look at energy transition. In addition, energy demand from the public is a huge driver of the energy system in general and we have to account for the fact that no one really wants “energy”. What people want is to heat and light their homes, move their vehicles, cook their dinners, charge their phones and wash their clothes.
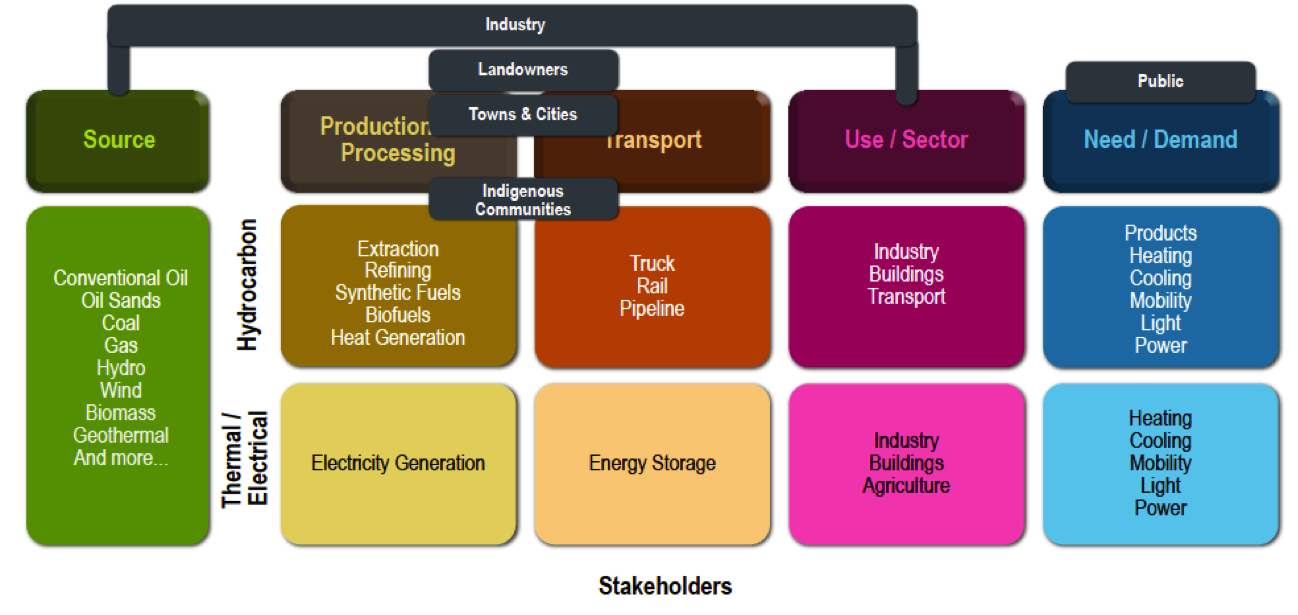
Working draft
Whew! That’s a lot – and I’m sure we are missing some layers. We would love to hear from you about areas we could add. Or if you have seen other great examples of mapping the energy system. In a future blog post, we will show you how we are using these maps to look at our prototypes and innovation pathways. This helps us answer questions such as: where might we have gaps in our approach? Where are there partners who are already doing this work? What are the levers we can pull that would give us the biggest impact? More soon!

Steve Williams is a technology strategist designing and facilitating participant-driven public engagement events with over 20 years experience in the software industry


